RFM Analysis
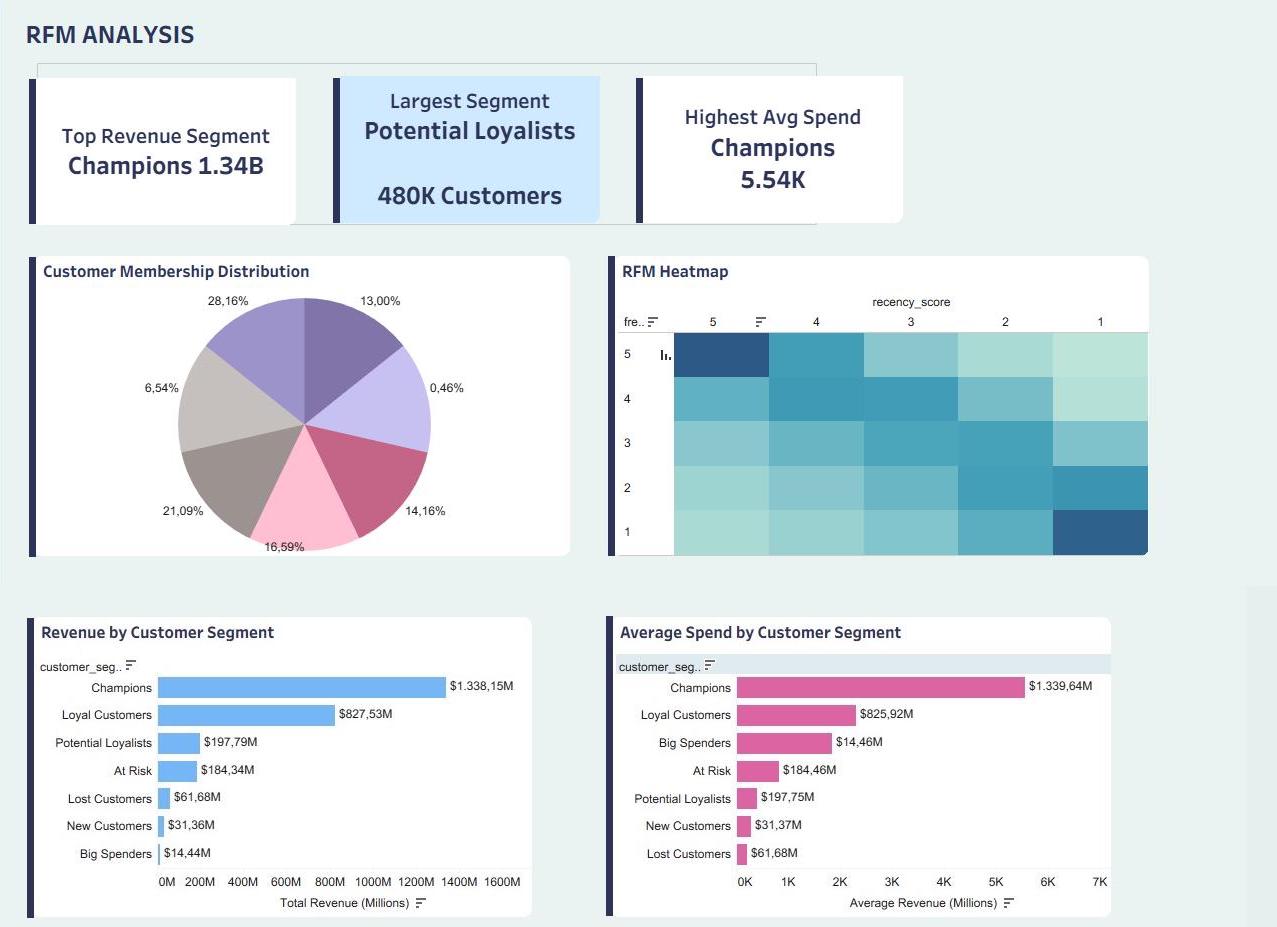
RFM Analysis turns transaction history into an action-oriented customer portfolio. The main story is not that every segment needs the same treatment: Champions and Loyal Customers carry most value, while Potential Loyalists are the largest development pool.
Key takeaway
Nova's customer strategy should protect the highest-value segments first, then convert the largest mid-potential segment into more frequent and higher-value behavior.
Key Findings
| Finding | Metric | Interpretation |
|---|---|---|
| Champions are the top value segment | About 242K customers, $1.34B total spend | A relatively small group carries the largest value pool |
| Champions also spend the most per customer | About $5.55K average spend | This is the segment to protect from churn or service quality issues |
| Loyal Customers are the second value pool | About 359K customers, $822.57M total spend | They are already engaged and should be reinforced |
| Potential Loyalists are the largest segment | About 481K customers, 28.18% of customers | This is the biggest conversion opportunity |
| Potential Loyalists have lower current value | About $197.92M total spend and $412 average spend | The segment needs frequency and monetary growth, not only retention messaging |
| At Risk customers still contain recoverable value | About 222K customers, $184.23M total spend | Reactivation should focus here before broad Lost Customer campaigns |
Business Insights
The RFM segmentation separates customer size from customer value. Champions are not the largest group, but they generate the most total spend and the highest average spend. Losing quality or engagement with this segment would be more expensive than losing a much larger low-value group.
Potential Loyalists are the strategic development pool. They are the largest segment, but their average spend is far below Champions and Loyal Customers. The opportunity is to move them from moderate engagement into repeat, higher-frequency behavior through targeted lifecycle offers and category recommendations.
Reactivation should be selective. At Risk customers have meaningful recoverable value, while Lost Customers are larger by count but much lower in value. Big Spenders are tiny, at about 0.46% of customers, so they are better suited to high-touch treatment than mass campaigns.
Recommendation
Protect Champions, reinforce Loyal Customers, build conversion programs for Potential Loyalists, and prioritize At Risk recovery before investing heavily in broad Lost Customer reactivation.
This page includes the dbt models used for the analysis.
dbt Model Flow
| Model | Grain | Role |
|---|---|---|
int_customer_metrics |
customer | Calculates transaction count, total spend, average order value, first and last order date, customer lifetime days, category count, and services used |
int_rfm_features |
customer | Derives recency, frequency, and monetary fields |
int_rfm_scores |
customer | Assigns 1-5 scores for recency, frequency, and monetary value |
mart_customer_segments |
customer | Maps scores into business-friendly segment labels |
Segment Logic
| Segment | Rule interpretation |
|---|---|
| Champions | Recent, frequent, and high-value customers |
| Loyal Customers | Strong frequency with acceptable recency |
| New Customers | Recent customers with lower frequency |
| Big Spenders | High monetary value with lower frequency |
| At Risk | Previously active customers with weaker recency |
| Lost Customers | Customers with the weakest recency |
| Potential Loyalists | Customers who do not fall into the other explicit groups |
Why this matters
RFM turns raw transaction history into a simple prioritization framework that can be used by marketing, retention, and customer strategy teams.