Category Performance Intelligence
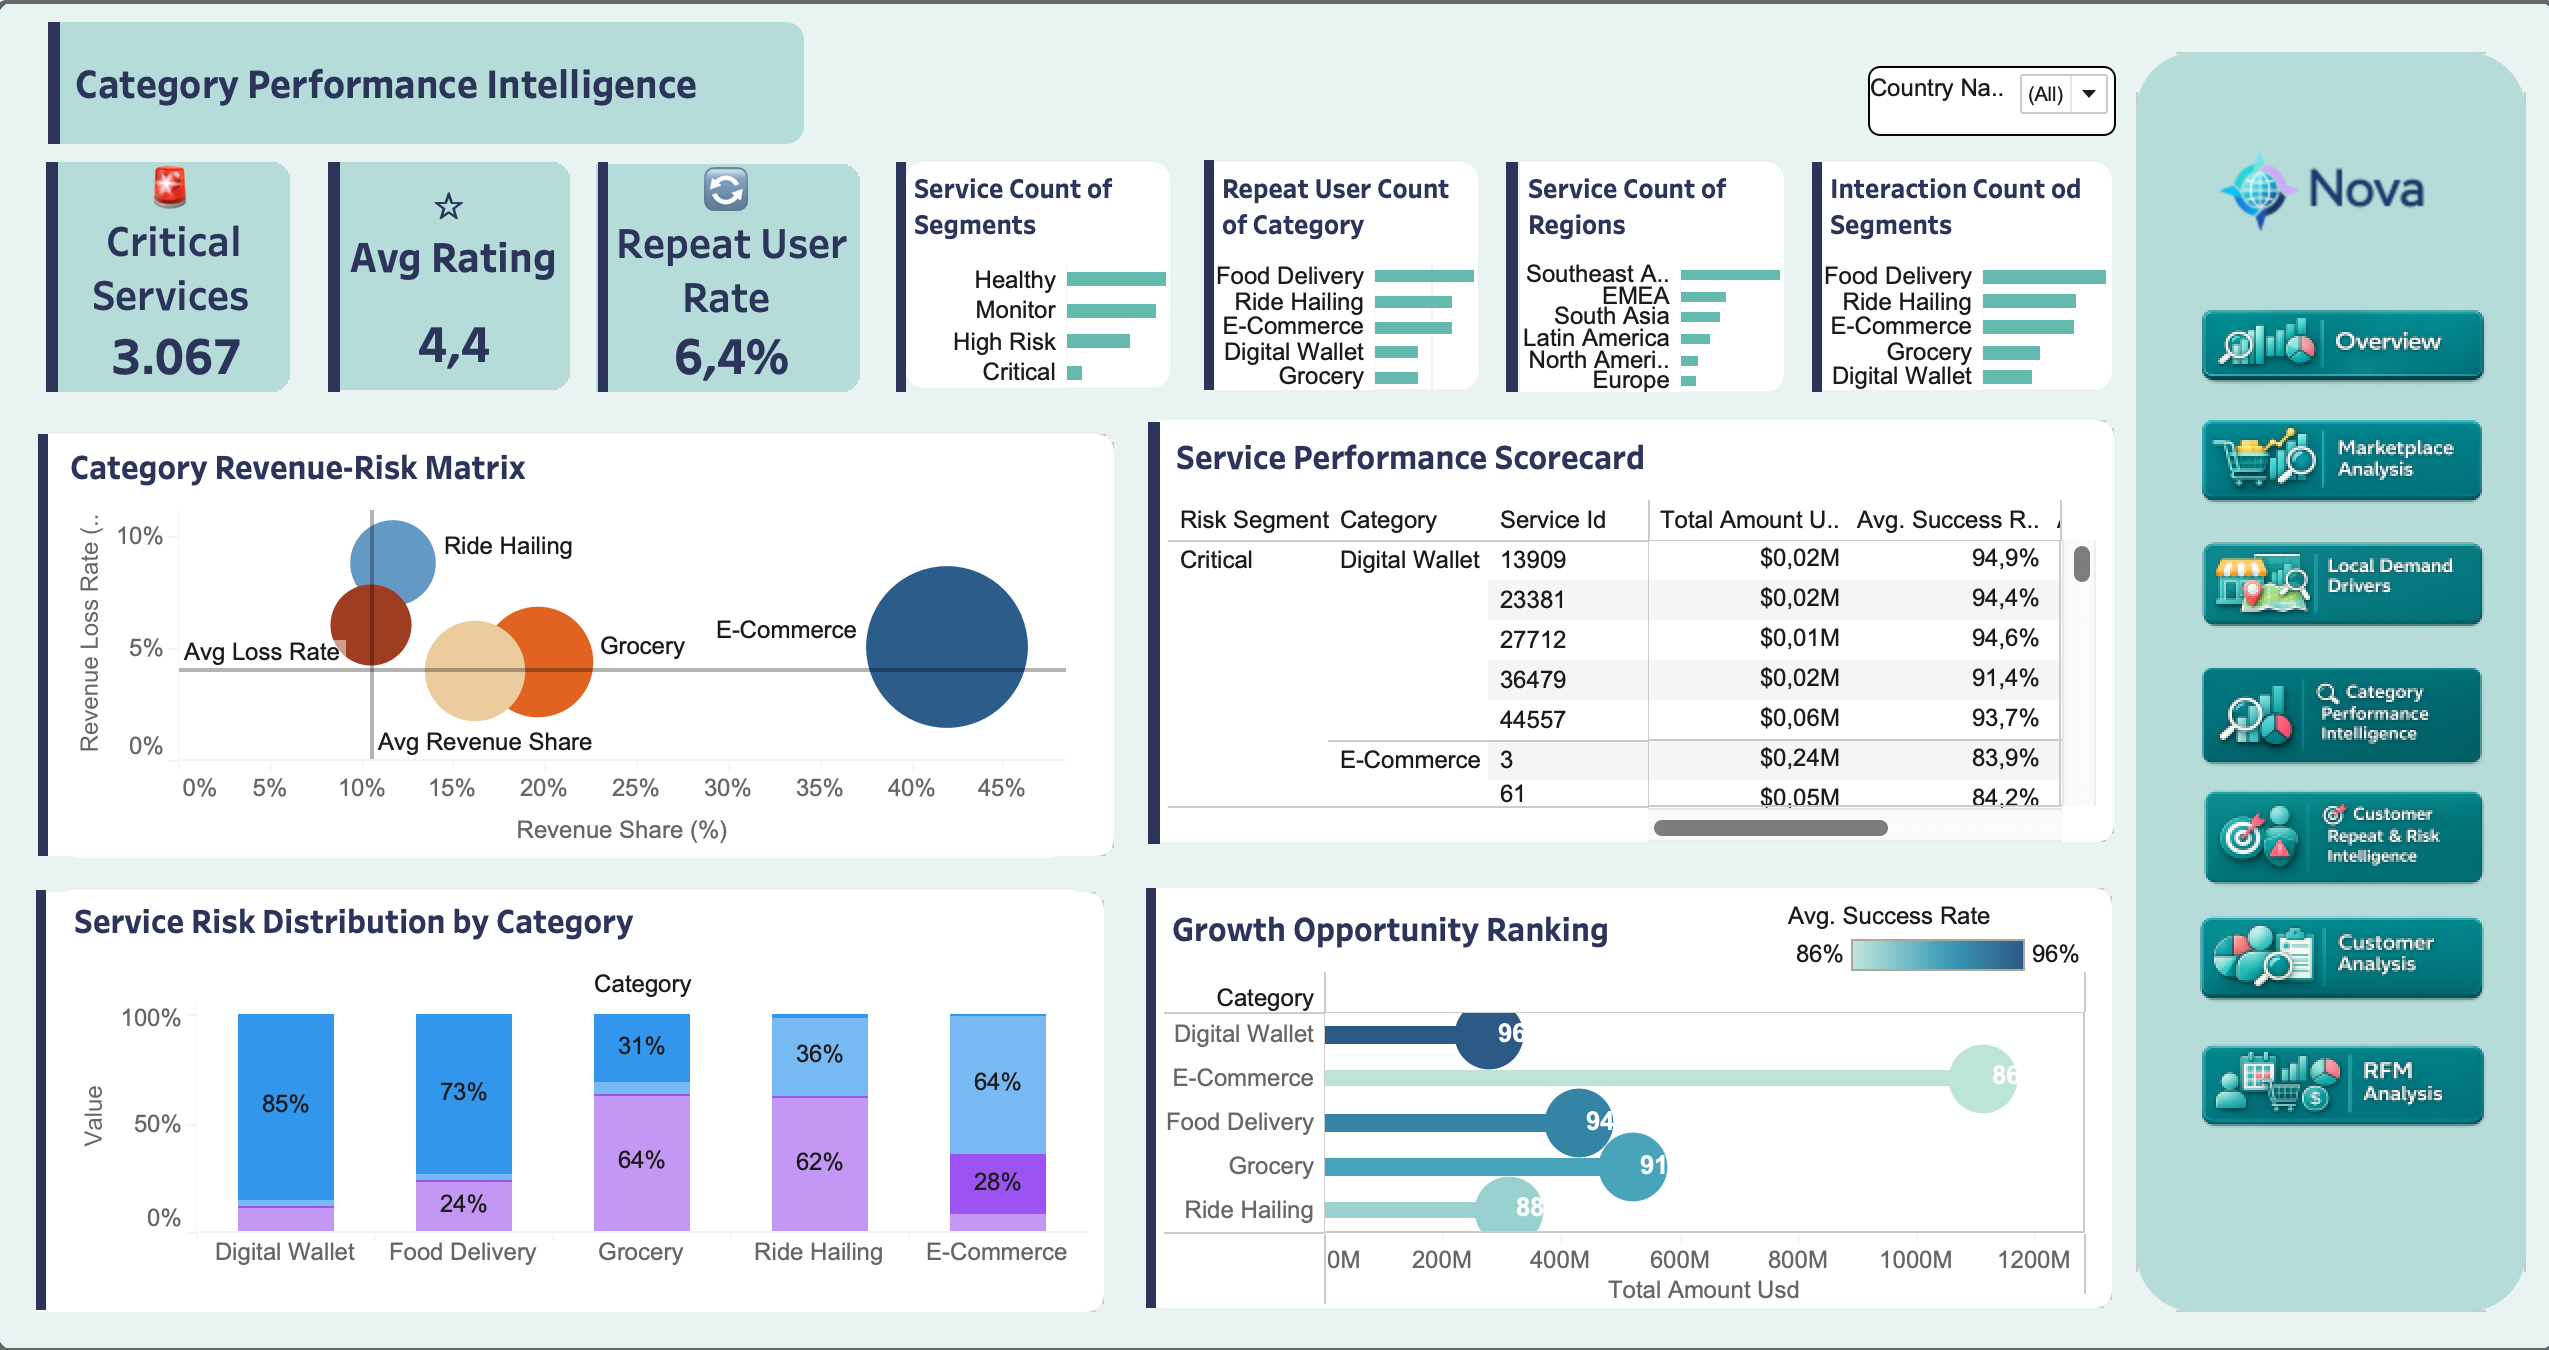
Category performance is a scale-versus-reliability story. E-Commerce is the largest value pool, but it also carries the weakest completion profile. Digital Wallet is much smaller, but it shows the strongest execution quality.
Key takeaway
Nova should not treat every category as an equal growth candidate. The biggest opportunity is to protect high-GMV categories where reliability leakage is expensive, while using stronger categories as operating benchmarks.
Key Findings
| Finding | Metric | Interpretation |
|---|---|---|
| E-Commerce is the value anchor | $1.11B GMV, 41.9% GMV share | The category drives the largest share of platform value |
| E-Commerce also has the weakest completion profile | 86.5% completion, about 15.0% non-completed amount rate | Reliability improvements here have the highest financial leverage |
| Food Delivery is the usage engine | 14.86M transactions, 93.6% completion | It drives the most interactions and performs better operationally than the largest GMV category |
| Grocery is the second-largest value pool | $520.8M GMV, 19.6% GMV share, 91.5% completion | It is large enough to matter, but should be monitored for service-risk concentration |
| Ride Hailing needs stabilization | $312.2M GMV, 88.0% completion, about 11.9% non-completed amount rate | The category has meaningful scale with weaker reliability |
| Digital Wallet is the reliability benchmark | 96.6% completion, $279.6M GMV | It is smaller, but shows the strongest execution quality |
Business Insights
The category portfolio is not simply a ranking by GMV. E-Commerce deserves the most attention because it combines the largest value base with the most visible reliability leakage. Even small improvements in completion, failure, or refund behavior would affect a larger dollar base than in any other category.
Food Delivery and Grocery tell a different story. Food Delivery has the highest interaction volume, making it important for daily engagement and operational capacity planning. Grocery is a large value pool with decent completion, but the dashboard's service-risk distribution suggests it should be watched before scaling aggressively.
The dashboard also surfaces 3,067 critical services, a 4.4 average rating, and a 6.4% repeat user rate. That means category performance should be managed below the category level: service health, service concentration, and risk segment mix determine whether growth is durable.
Recommendation
Prioritize reliability work in E-Commerce and Ride Hailing, use Digital Wallet as the quality benchmark, and review critical or monitor services before pushing growth investment into categories with elevated non-completion risk.
This analysis is built with dbt service-health and category-health models. It does not use predictive modeling.
dbt Model Flow
| Layer | Models | Purpose |
|---|---|---|
| Staging | stg_interactions, stg_services, stg_markets |
Standardize corrected transaction, service, and market data |
| Intermediate | int_services_enriched, int_service_interactions, int_service_health, int_service_risk, int_category_health |
Join services to interactions, aggregate service performance, classify service risk, and roll up category health |
| Mart | mart_category_performance, mart_category_market_performance, mart_marketplace_service |
Provide Tableau-ready category, market-category, and service-level reporting tables |
Risk Logic
Service risk is assigned from operational signals:
| Signal | Role |
|---|---|
| Success rate | Measures completed interaction reliability |
| Failure rate | Flags services with elevated failure behavior |
| Refund rate | Captures revenue and quality leakage |
| Rating | Adds customer-facing service quality context |
The category dashboard then rolls these service-level signals into category-level risk and growth views.
Why this matters
The dashboard is not just visualizing raw category totals. It is built from a service-level health model, which lets category performance reflect both scale and operational quality.