Customer Repeat & Risk Intelligence
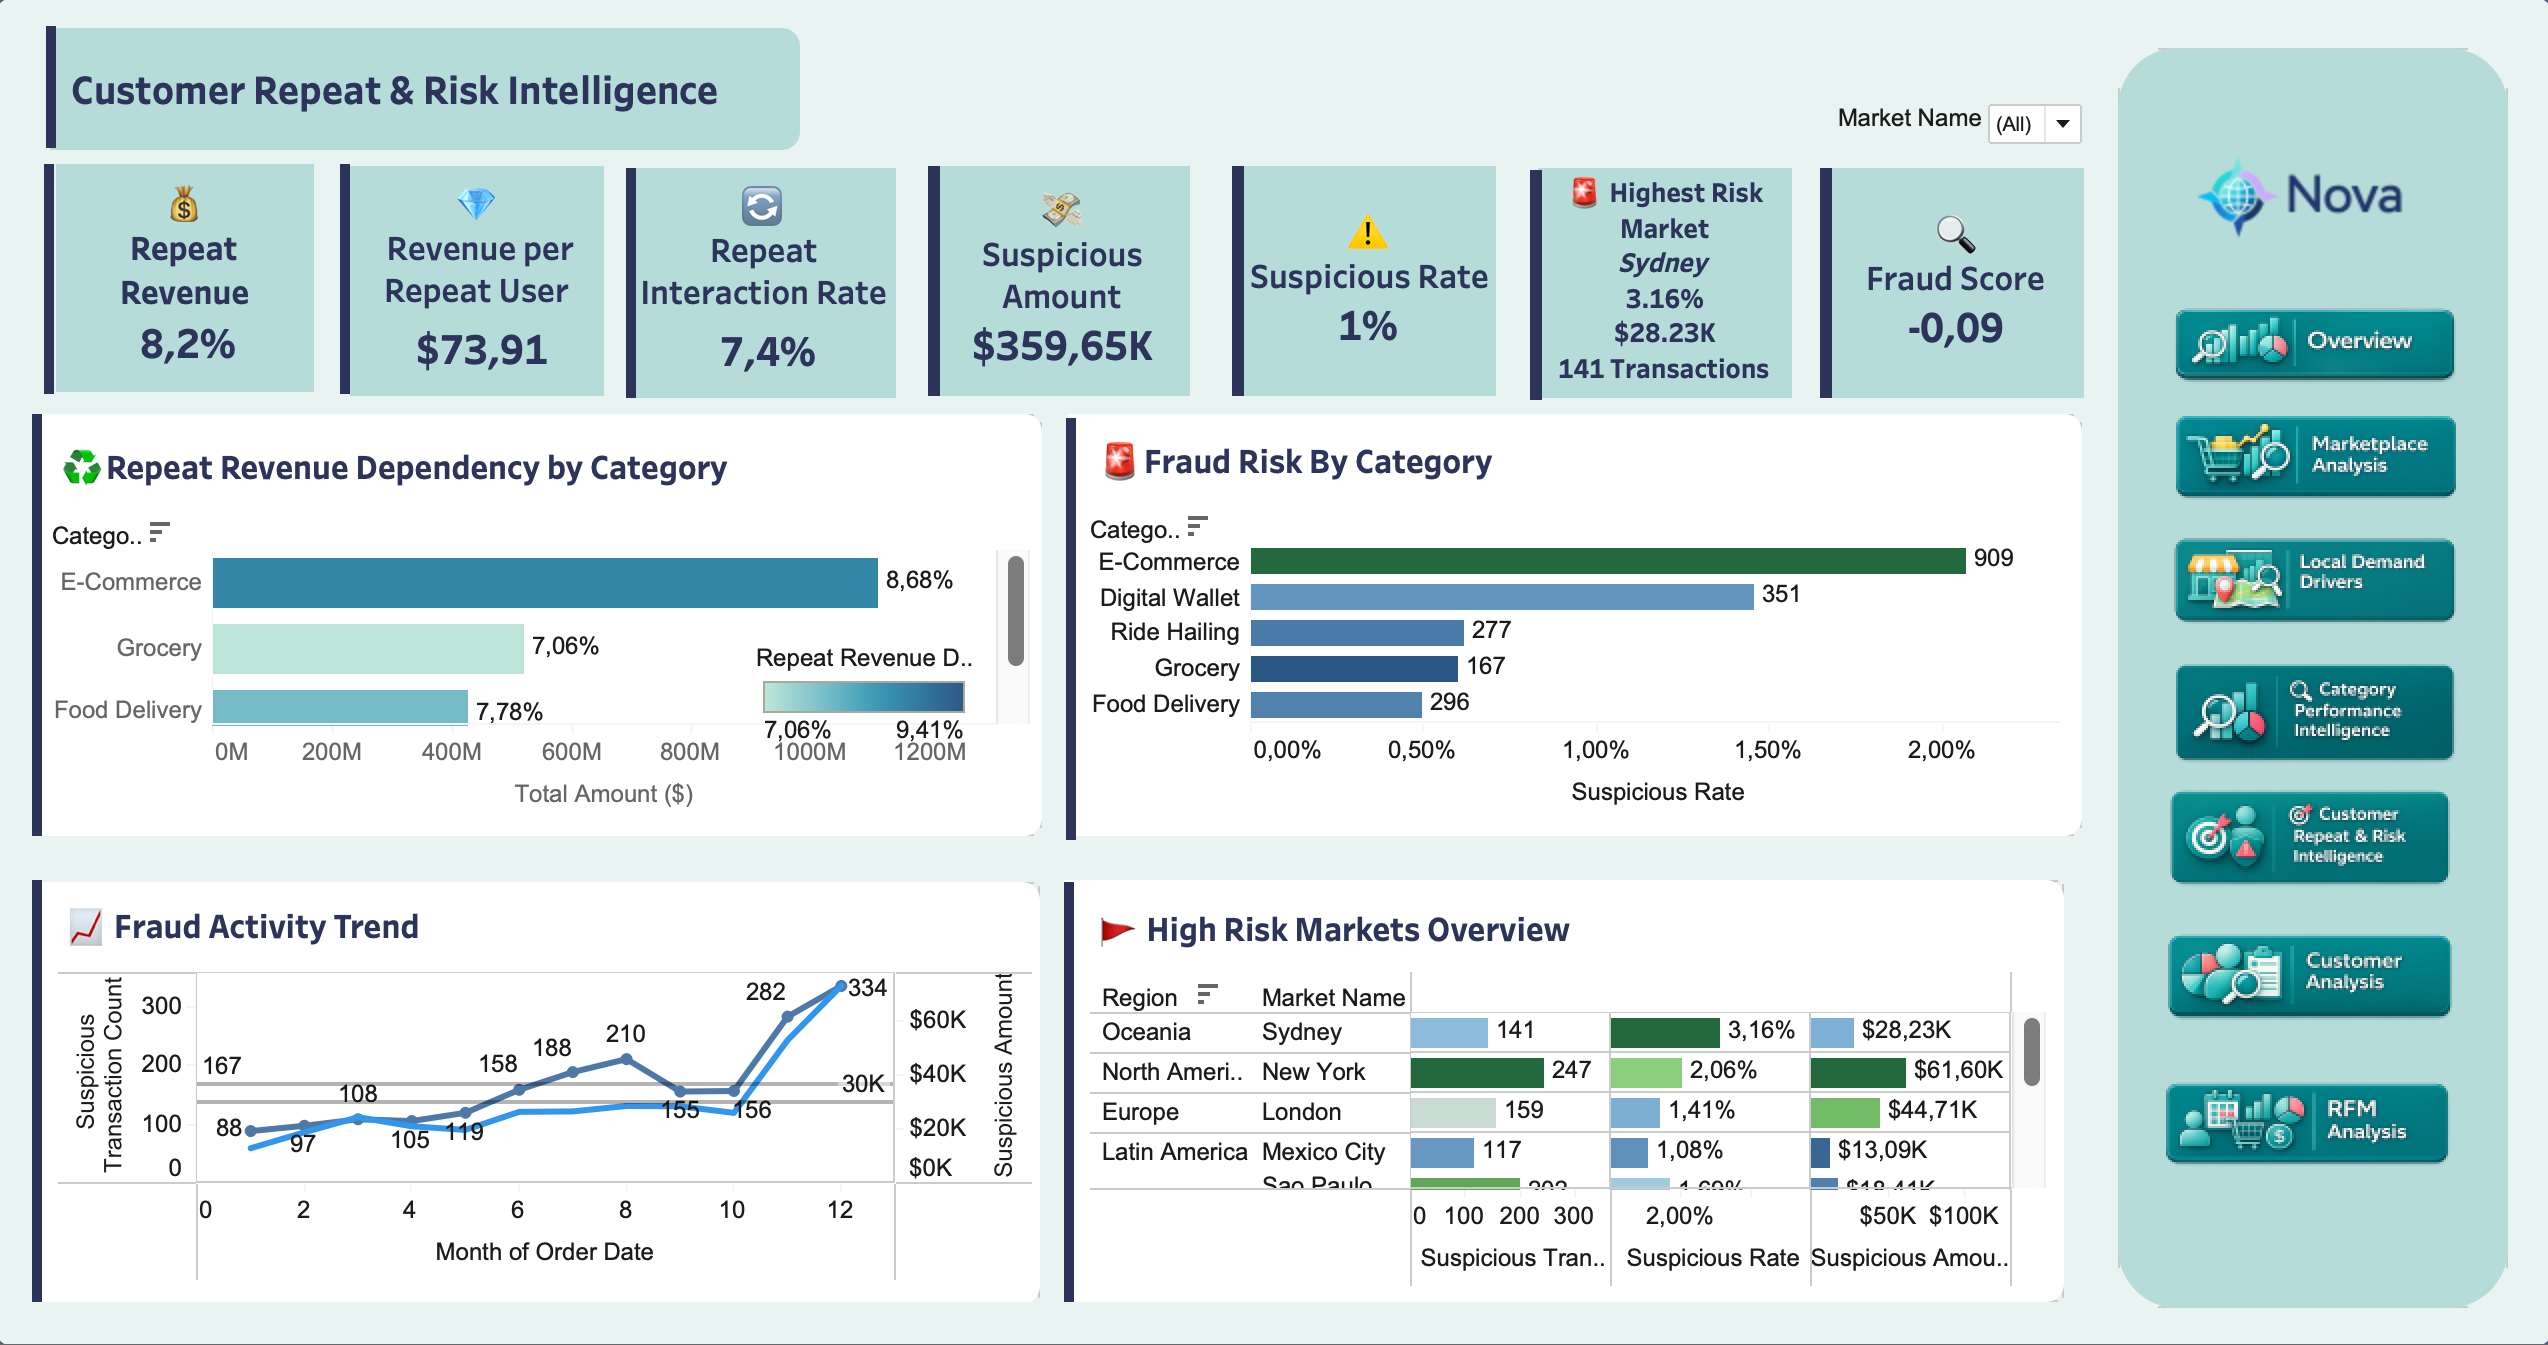
Customer Repeat & Risk Intelligence combines loyalty signals with transaction anomaly monitoring. The business story is balanced: repeat behavior contributes meaningful value, but it is not yet the dominant engine of the marketplace, and suspicious activity is low-rate but concentrated enough to require targeted review.
Key takeaway
Nova should grow repeat behavior while protecting the categories and markets where suspicious activity is most concentrated. Retention and risk monitoring need to be managed together.
Key Findings
| Finding | Metric | Interpretation |
|---|---|---|
| Repeat behavior is meaningful but not dominant | 8.2% repeat revenue share, 7.4% repeat interaction rate | Nova has repeat customer value to grow, but the marketplace is not yet repeat-led |
| Repeat customers have measurable value | $73.91 revenue per repeat user | Retention work can improve customer economics if targeted to the right categories |
| E-Commerce has the strongest repeat dependency | 8.68% repeat revenue share | Retention in the largest value category has the biggest financial upside |
| Suspicious activity is low-rate | 1.0% suspicious rate, $359.65K suspicious amount | The signal is not broad platform failure, but it is large enough for review workflows |
| E-Commerce has the highest suspicious category volume | About 909 suspicious transactions, roughly 2.1% suspicious rate | Fraud controls should start where value and suspicious activity overlap |
| Market risk differs by rate and exposure | Sydney: 3.16% suspicious rate, 141 transactions, $28.23K; New York: 247 transactions, $61.60K | Sydney needs rate-based investigation, while New York has larger value exposure |
Business Insights
Repeat behavior is an opportunity, not a solved advantage. The dashboard shows that repeat users contribute a real share of value, but most transaction value still comes from non-repeat behavior. That makes E-Commerce the clearest retention priority because it combines the largest value base with the strongest repeat-revenue dependency.
Suspicious activity should be treated as a focused review queue, not a blanket fraud claim. The model flags anomalies, and the highest-priority areas are where suspicious concentration and business exposure overlap: E-Commerce by category, Sydney by suspicious rate, and New York by suspicious value.
The activity trend also matters. Suspicious transaction counts rise toward the end of the year, which suggests monitoring thresholds and review capacity should be checked over time instead of treated as a static dashboard metric.
Interpretation
Suspicious transactions are model-generated anomaly candidates, not confirmed fraud. A high-risk market is not automatically a bad market; it is a place where Nova should investigate patterns, tune controls, and prioritize review.
This page combines repeat-behavior dbt modeling with an unsupervised fraud anomaly model built in Python.
Repeat Behavior Pipeline
| Model | Grain | Role |
|---|---|---|
int_user_service_repeat_behavior |
user + service | Counts repeat interactions and user-service value |
mart_service_repeat_behavior |
service | Aggregates repeat users, repeat interactions, repeat revenue, and repeat amount share |
Fraud Modeling Pipeline
| Step | Artifact | Role |
|---|---|---|
| Feature engineering | ml_transaction_fraud_features |
Builds transaction-level behavioral features for anomaly detection |
| Notebook model | notebooks/fraud_detection_isolation_forest.ipynb |
Trains an Isolation Forest model with scikit-learn |
| Model output | ml_transaction_fraud_scores_sample |
Stores anomaly scores and suspicious flags in BigQuery |
| Tableau mart | mart_transaction_fraud_tableau |
Joins scores back to transaction, customer, service, and market context |
The model uses transaction amount, transaction timing, user velocity, 24-hour spending, prior spending behavior, cross-market activity, cross-service activity, late-night behavior, failed transactions, and refunded transactions.
Modeling caveat
The source data has no labeled fraud outcome. The Isolation Forest model flags anomalous transactions for review; it does not prove fraud.