Executive Summary
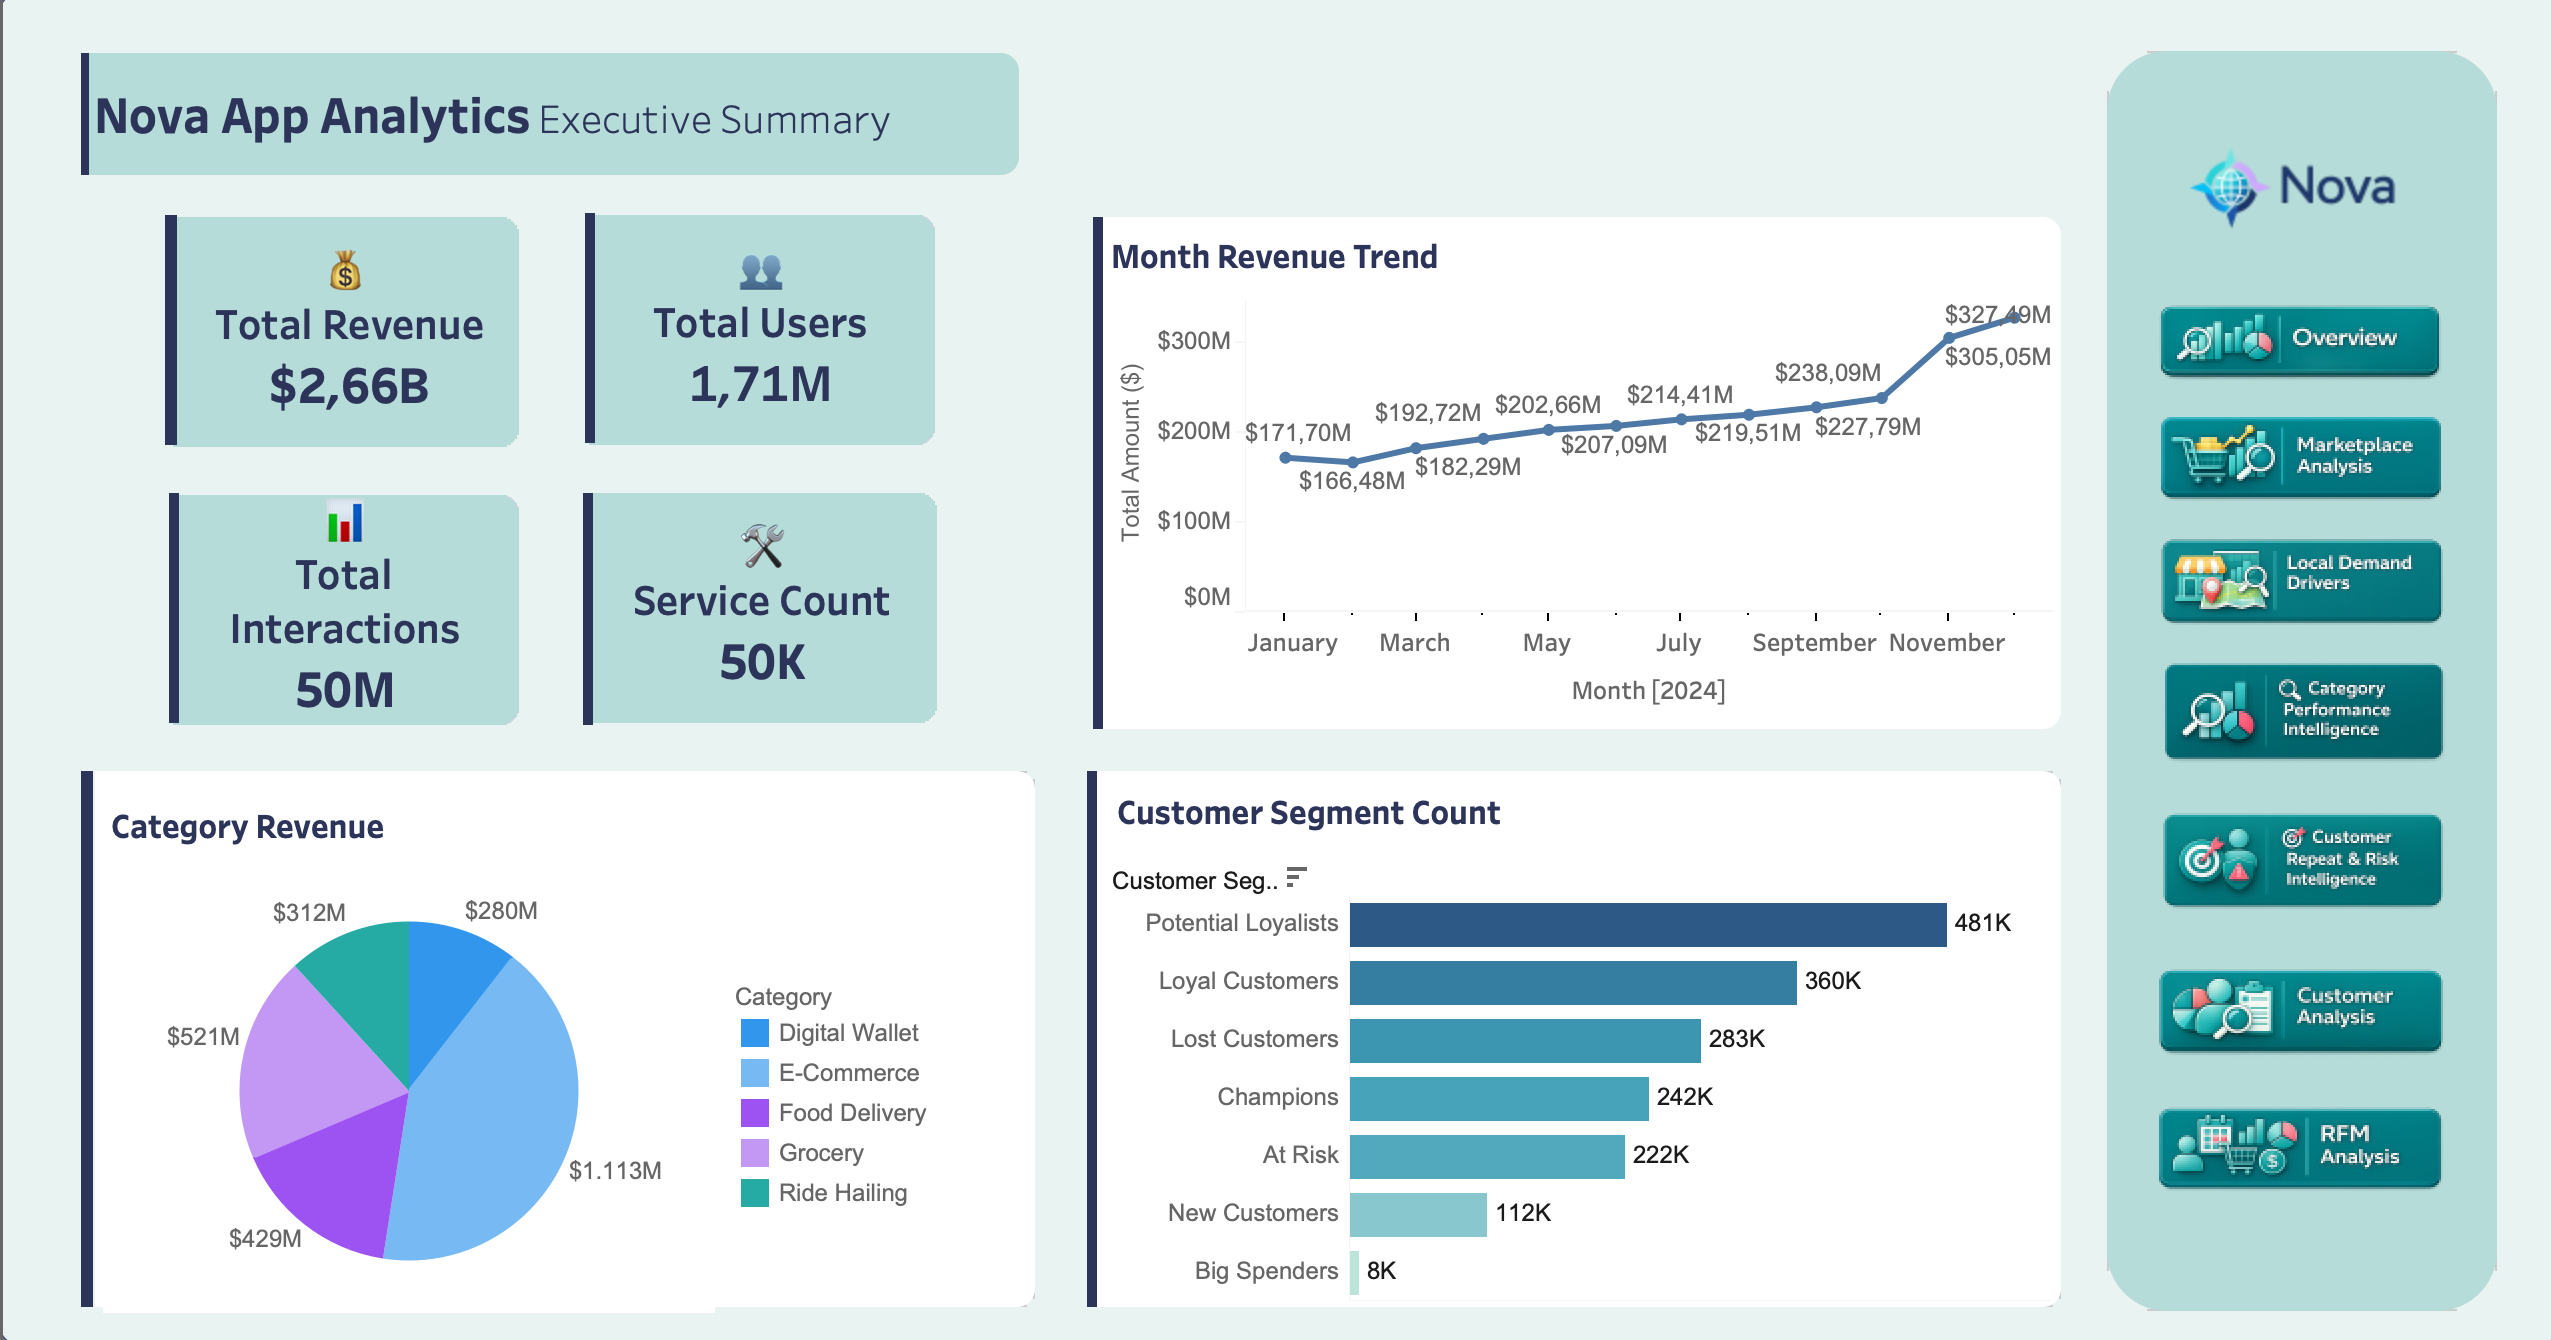
Nova processed $2.66B in GMV across 50M interactions in the regenerated 2024 dataset. GMV, or Gross Merchandise Value, represents the total transaction value flowing through the platform before separating merchant revenue from Nova's commission.
Across the year, Nova served 1.71M active users through 50K services. The headline story is a scaled marketplace with clear late-year momentum, strong category concentration, and meaningful customer segmentation signals.
Key takeaway
Nova is already operating at marketplace scale. The next question is not whether there is activity, but where that activity is concentrated and which levers can turn scale into higher-quality growth.
Key Findings
| Finding | Metric | Interpretation |
|---|---|---|
| Marketplace scale | $2.66B GMV, 50M interactions, 1.71M active users, 50K services | Nova has enough scale for market, category, customer, and risk analysis to be meaningful |
| Late-year growth | Monthly GMV rose from $171.7M in January to $327.5M in December | The modeled marketplace shows strong year-end acceleration |
| Category concentration | E-Commerce leads with about $1.11B GMV | E-Commerce is the largest value driver and deserves close performance/risk monitoring |
| Customer base shape | Potential Loyalists are the largest segment at about 481K customers | The biggest customer pool is not yet fully mature, which creates an upsell and retention opportunity |
Business Insights
Nova's 2024 performance is not evenly distributed. E-Commerce carries the largest GMV, customer segments vary sharply in maturity, and monthly value increases through the year. That makes the rest of the analysis necessary: growth strategy should account for where Nova operates, what drives local demand, which categories carry operational risk, and which customer groups can be developed further.
Recommended reading
Start with the marketplace and demand-driver pages to understand where growth can come from. Then use category, customer, and risk pages to decide how to protect that growth.
The Executive Summary is the final presentation layer of a full analytics pipeline, not a standalone dashboard.
Pipeline Overview
| Stage | Work performed | Main artifacts |
|---|---|---|
| Dataset correction | Regenerated the synthetic Nova dataset for more realistic seasonality, market behavior, customer lifecycle, category behavior, weather effects, and fraud-like signals | scripts/generate_corrected_dataset.py, scripts/validate_corrected_dataset.py |
| Warehouse ingestion | Loaded corrected Nova interactions, users, services, and markets into BigQuery | source('raw', ...) tables |
| dbt modeling | Standardized raw sources, built intermediate metrics, and materialized analysis-ready marts | stg_*, int_*, mart_* models |
| Notebook modeling | Built predictive or unsupervised modeling where the analysis required it | demand regression, market clustering, fraud anomaly notebooks |
| Visualization | Published Tableau pages from dbt marts and notebook outputs | dashboard screenshots shown throughout the analysis section |
Quality Gates
The pipeline includes validation before the dashboards are interpreted:
- corrected dataset validation confirms 50M rows, key coverage, date coverage, category/service consistency, lifecycle variation, weather sensitivity, and fraud-like behavior signals;
- dbt schema tests enforce key fields, accepted values, and relationships;
- custom dbt tests check geography grains, feature-mart coverage, reconciliation between market-day and category-day totals, and weather uniqueness.
Why this matters
The executive dashboard is only the final output. The project value comes from the data correction, transformation, testing, modeling, and interpretation work that makes the dashboard credible.